Chapter 4
Experiment and Results
Two weeks of system mail were analysed in the experiment. From over 32,000,000 syslog message entries 2,644,135 message views were reconstructed.
4.1. Overwhelmingly Delivered
The good news is that the majority of e-mail sent is delivered, and delivered from sources that have very low message rejections rates.
The first conclusion drawn from this is that most e-mail being sent from the system under test is not spam. This assertion is reinforced by the system’s excellent reputation with major RBL providers.
Because the intent of this research is to identify customer accounts being used to spam, the rest of this chapter will focus on what is learned from the undelivered messages.
4.2. The Undelivered
Of the 2,644,135 message views extracted from the logs, 2,525,469 were successfully delivered. This leaves 115,666 messages or 4.37% undelivered in the two week period.
4.2.1. The Long Tail: less than 250 messages per week
Sources that did not send at least an average of 250 messages per week over the test period are removed from further analysis. These sources’ volume is too low to draw any concrete conclusions.
The long tail of low volume users is removed from further consideration. This represents 94.2% of the sources sending mail, yet they account for 21.5% of the total volume moved, and only 9.7% of the undelivered mail. Hence the conclusion that these low volume senders can be reasonably considered not to be spammers.
4.2.2. Smaller number of high volume sources
Senders attempting to deliver over 250 messages per week represent 779 of the 13379 unique sources seen, or 5.8%. In volume they are responsible for 78.5% of messages, and 90.3% or 104,495 of the undelivered mail.
This corpus exhibits a second long tail pattern. Of these senders, most exhibit an over 91% delivery rate. Plotting sources to percentage of undelivered mail demonstrates this effect in Figure 14.
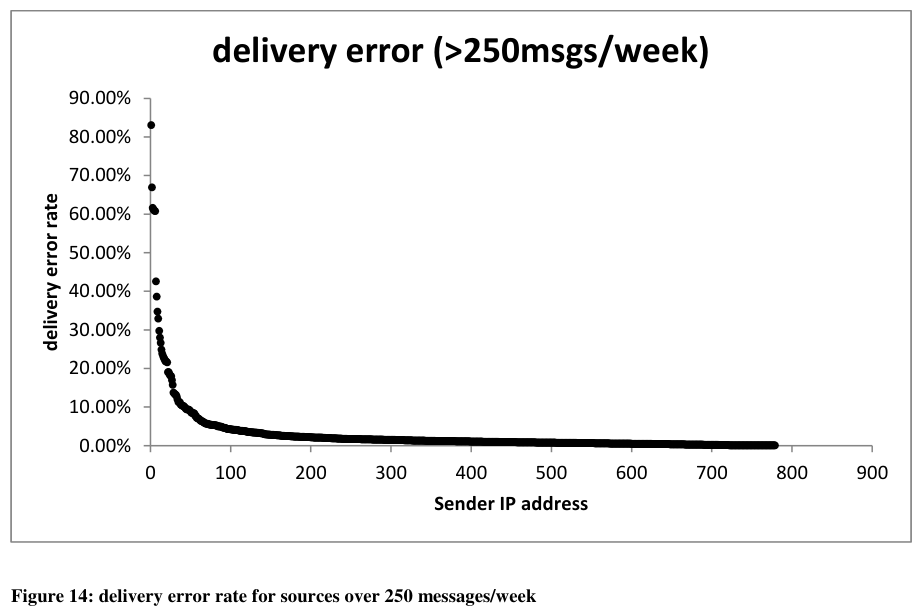
Figure 14: delivery error rate for sources over 250 messages/week
The undelivered data is more useful if expressed as delivery error rate to overall message volume, as demonstrated in Figure 15. This graph again shows that the majority of senders have a very low error rate and very high acceptance rate from foreign e-mail systems for their messages sent.
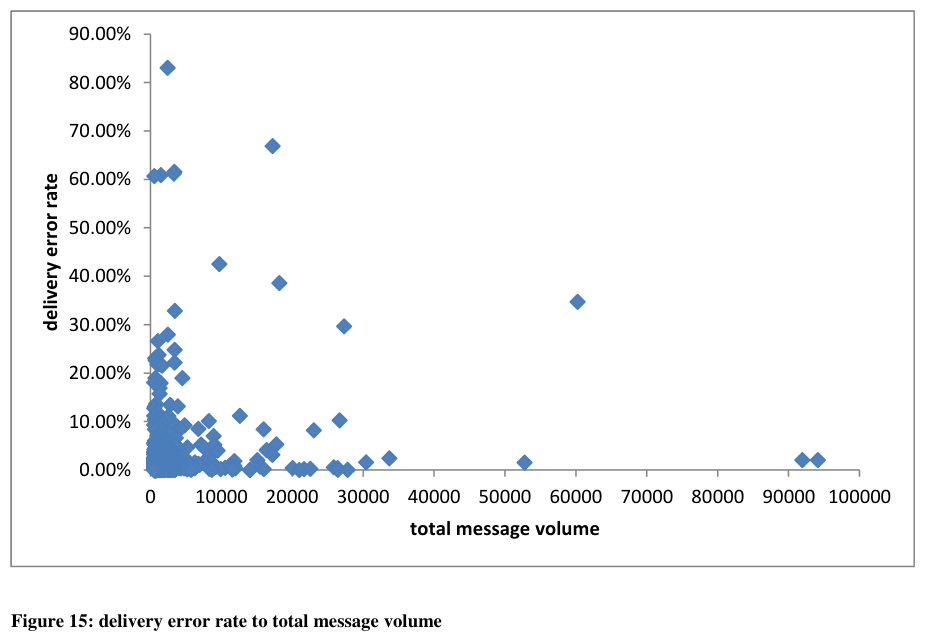
Figure 15: delivery error rate to total message volume
The output to focus on as spammer candidates are the high volume and high error rate sources, or the upper right quadrant of Figure 15.
4.2.3. Over 9% undelivered
To further reduce the number of sources under analysis, a second criterion is added to the data set: only senders for whom more than 9% of messages are undelivered will be scrutinized.
Again, this cut mostly removes senders with valid recipients from the mix.
Only 49 (0.37%) of 13379 total sources satisfy the condition of attempting to send more than 250 messages per week, while having over 9% undelivered.
Yet this small percentage of senders is responsible for 9% of the total volume of messages delivered in the study timeframe, and more importantly 53% of the volume of undelivered messages.
In depth analysis of this group was limited to the highest volume senders. For privacy reasons, of the whole 13,379 sender data set, only detailed message view information on the top 50 senders by total volume was kept.
One of this works’ base hypotheses to test in a complex large scale e-mail platform is that a high volume of rejected messages translates to a very likely spammer sender. With the constraint that in-depth data was only kept for the top 50 overall senders, manual verification is only possible for the top 8 senders in the 9% undelivered sub-set.
Table 1: 8 sources with the highest ratio of undelivered messages
| source | total | sent | bounce | defer | undelivered (B + D) | deliver % | undelivered % | HVS or LVS |
|---|---|---|---|---|---|---|---|---|
| 1 | 60228 | 39330 | 17928 | 2970 | 20898 | 65.30% | 34.70% | HVS |
| 2 | 27322 | 19220 | 7250 | 852 | 8102 | 70.35% | 29.65% | HVS |
| 3 | 26662 | 23929 | 1224 | 1509 | 2733 | 89.75% | 10.25% | HVS |
| 4 | 18174 | 11162 | 6038 | 974 | 7012 | 61.42% | 38.58% | LVS |
| 5 | 17246 | 5709 | 8064 | 3473 | 11537 | 33.10% | 66.90% | HVS |
| 6 | 12618 | 11206 | 1298 | 114 | 1412 | 88.81% | 11.19% | LVS |
| 7 | 9718 | 5587 | 2208 | 1923 | 4131 | 57.49% | 42.51% | LVS |
| 8 | 8240 | 7408 | 791 | 41 | 832 | 89.90% | 10.10% | unsure |
For these 8 senders, the author is certain after manual analysis that the top 7 are spammers. Of these, four exhibit high volume spam patterns – a large volume of mail sent over a short time frame to a sequential list of recipients. Another three are low volume spammers, with messages trickled through over the entire duration of the experiment to a random list of recipients. The low volume senders also mutated their envelope source address on each send, the reasons for this cannot be precisely determined; however it would have the effect of hiding the spamming activity from analysis systems based solely on envelope sender addresses. The changed source address could also be used to track responses to the messages.
Only one sender cannot be clearly identified as a spammer, and could qualify as a poorly maintained mailing list. Looking at the detailed message data supports the poor mailing list hypothesis: the sender is a company that appears to only operate in one Australian State, and the majority of their recipients also appear to be in this same State.
4.2.4. A Viable Automated Cut-off Threshold
If an automated cut-off were to be devised from this data set for the e-mail system under study, it would be to block all sources that send over 4000 messages per week, and have over 25% rejected by the destination e-mail systems. This would amount to 5 out of 13379 sources, yet represent 5% of the total messages sent, and an astonishing 44.6% of all undelivered mail. These cut-off figures are designed to avoid false positives, and would not block uncertain cases such as the 8th sender in Table 1.
In other words, it is possible to find a cut-off level for spammer source detection in a complex e-mail system that is based on SMTP response codes alone. In this case with the over 4000 messages/week and over 25% rejected thresholds applied, almost half of the undelivered messages in the e-mail service providers outbound flows would be prevented from being sent.
For organizations that do not wish to implement automated blocking systems, the number of senders that meet this criteria (five, out of a customer base of over 100,000) is sufficiently low to validate manually.
4.3. Mailing Lists
Previous attempts to limit outbound spam have triggered on a source’s message volume. The output of this work confirms that this is a poor metric to choose because it would block legitimate mailing lists while allowing a considerable volume of low volume spam to pass.
Two types of mailing list or mass mail out activity is found within the dataset used for this work. Either:
- One copy of a message is sent to the e-mail system, with a large set of envelope recipients – a “rcpt to:” entry for each. This method is most efficient in conserving client bandwidth, as the body of the message need only be sent once. However it also implies that each message must be the same, limiting its use to mailing lists.
- The entire message is sent once per recipient. This creates a larger volume of individual messages moving through the e-mail system, and consumes more client bandwidth. This method allows the messages to be personalized for a mailing list, or for mass mail-outs such as those generated by monthly billing runs where thousands of customers would be sent an invoice.
High volume mailing list activity belongs in the bottom right quadrant of Figure 15: many messages are sent, but very few are rejected from the recipient mailsystems. The author hypothesises that vigorous anti-spam laws have made most legitimate companies and organizations place more stringent checks on their mail-outs, whereas spammers can perform no such checks. The result remains: blocking by volume alone is not viable for the e-mail system operator as it will block considerable volumes of legitimate e-mail.