Chapter 3
Architecture and Algorithm
In this work, in order to determine whether the messages that a subscriber delivers to an e-mail system are spam, we must trace the path taken through the system by the subscriber’s messages.
The correlated result provides a complete view of the treatment of each message sent by a subscriber. Building this complete view for e-mail systems which have more than one server or one server type involved in relaying outbound e-mail is part of the novelty of this work.
In this section the challenges for building this complete view and how they were resolved are explained.
3.1. Data Source: E-mail System Logs
The data source analysed in this work originates from e-mail system logs generated by servers and the Postfix MTA application. In the background section, the syslog mechanism and protocol was introduced as a standard means of collecting information about the processing of emails as they traverse a system.
Note that while syslog is used here, the process would be similar for other logging or infrastructure tracing mechanisms. Examples of alternate technologies are Microsoft’s Windows Events [6], and Facebook’s Scribe [27].
3.1.1. E-mail System Log Collection
A central syslog host is used to aggregate the streams of syslog events emitted by all the servers in the outbound flow processing chain. The analysis system processes this centralized data.
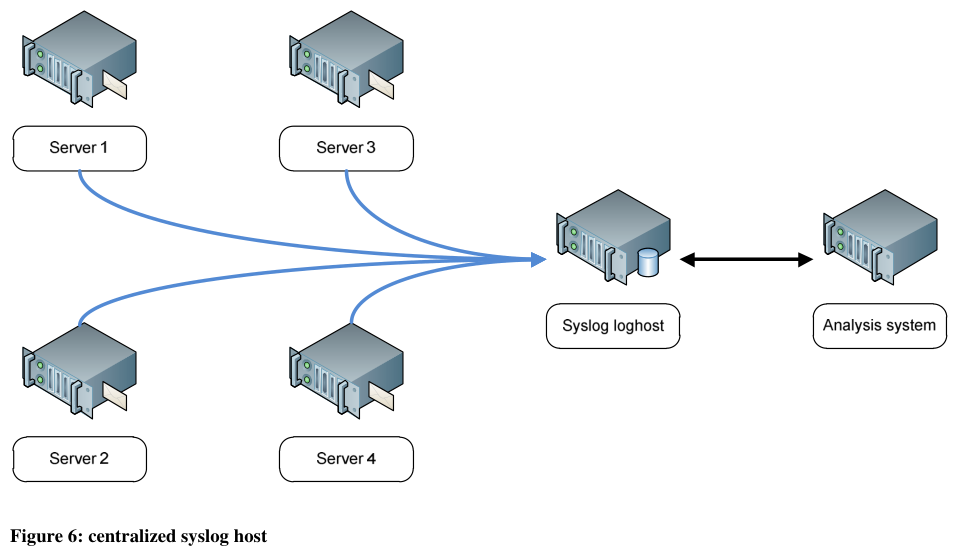
Figure 6: centralized syslog host
Figure 6 provides a graphical representation of the log aggregation process. The loghost writes its logs in a format that complies with the updated syslog RFC 5424 [8] published in 2009. This format is more reliably parsed from a text form than its predecessor RFC 3164 [7].
3.2. The Problem of Complexity
E-mail system complexity makes the task of building the complete view of a message traversing a system much more difficult than the single server case.
As the term implies, the simple case illustrated in Figure 7 has a single application (denoted as a daemon) running on a single server.
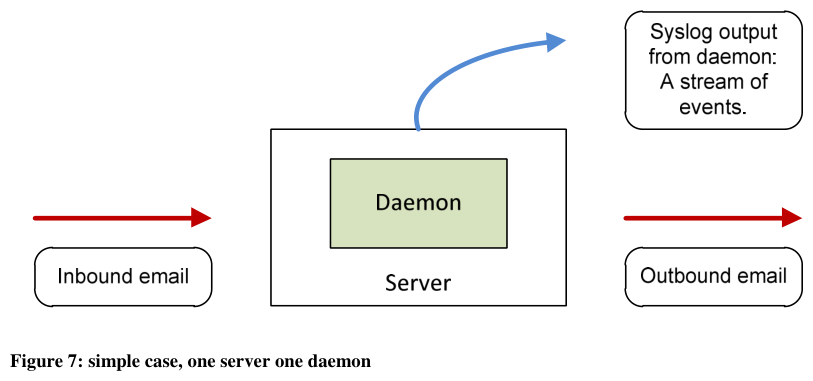
Figure 7: simple case, one server one daemon
The single server type still allows for many servers of the same type to be deployed to for reasons of redundancy or capacity. If many servers with the same functional configuration are deployed, it can be said that their operation is idempotent for any given recipient.
Complexity is introduced by using more than one application in processing mail, and having more than one functional processing stage.
3.2.1. Multiple applications
In mailsystems, it is common to have multiple applications or daemons process a message to get a result. This is illustrated in Figure 8, where a message would have to traverse three applications before exiting the server.
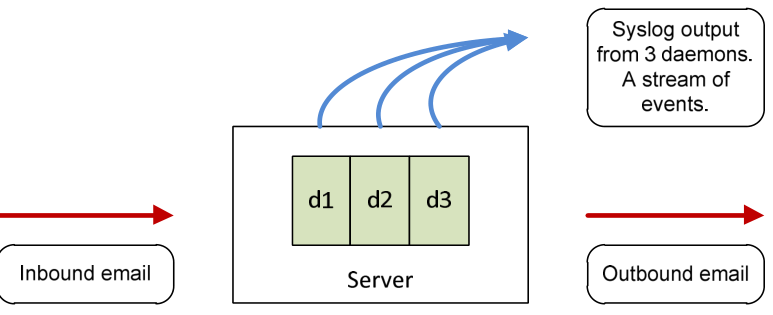
Figure 8: single server multiple application
An example of this is processing by anti-spam and anti-virus content analysis software. The first daemon is an MTA that accepts messages from the upstream system, the following daemons are content processors. The processed message is handed to the exit MTA for delivery to the next system in the chain.
This case is not tracked in this analysis, but would be a logical extension of the research.
3.2.2. Multiple Applications, Multiple Servers
For the analysis framework to be suitable to as many real world e-mail systems as possible, it must cope with the logs generated by e-mails as they traverse multiple servers, each potentially running multiple daemons.
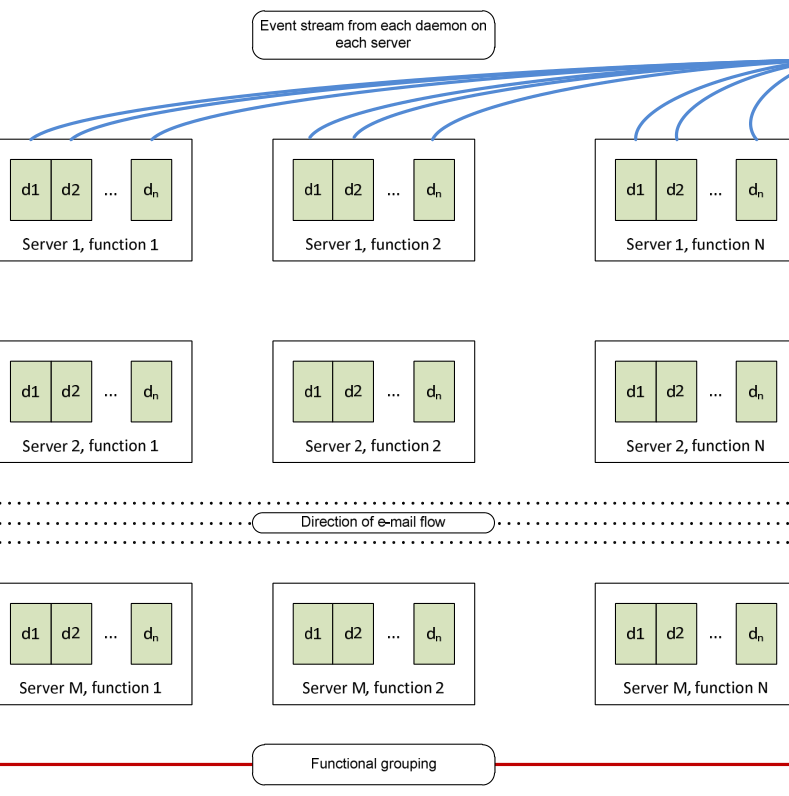
Figure 9: multiple applications, multiple servers
The general case is illustrated in Figure 9. Any e-mail entering a system can be processed by any number of applications for a given functional grouping. Functions are expressed in the horizontal axis, and functional replicas for throughput, redundancy, or datacentre diversity are expressed in the vertical axis.
The number of paths that an email can take when traversing a given system is computed by multiplying the number of functions N by number of servers per function M. This will vary if each function is not serviced by a constant number of servers.
3.2.3. E-Mail System under Test: Pacnet Internet
The actual system under test in this work is the outbound flow processing stage used by Pacnet Internet as shown in Figure 10.
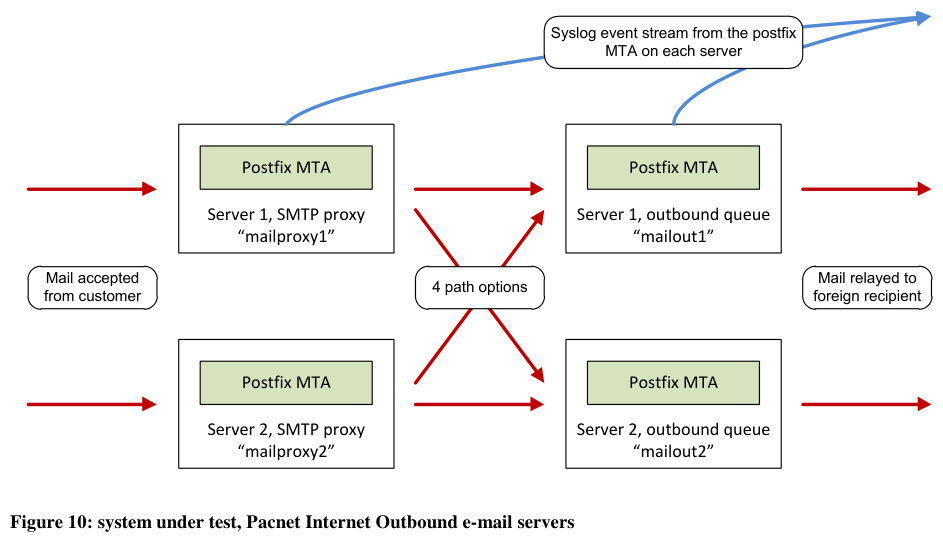
Figure 10: system under test, Pacnet Internet Outbound e-mail servers
Outbound messages are subject to two functional server types.
- Front-end proxies that accept messages for relaying and validate that they are originating from customers. This validation is done using mechanism introduced in 2.6.4: the originator’s IP address, or authentication.
- Back-end mail queues handle the actual delivery to the recipient’s e-mail system.
The functions are separated because the back end queuing process can take time to clear if there is an issue with delivering the message to the destination. Handling peak loads can also make the back-end systems less responsive. Other mail servers can tolerate this unresponsiveness and retry, but experience has shown that e-mail clients and the persons using them cannot. Hence the front end servers are kept lightly loaded to provide a low response latency.
From this design we can infer that in building the complete view of a message traversing the system, copies to each recipient will show two hops, using one of the four paths:
- Mailproxy1 to Mailout1
- Mailproxy1 to Mailout2
- Mailproxy2 to Mailout1
- Mailproxy2 to Mailout2
When there are multiple recipients to a message, each recipient’s path taken through the system is not guaranteed to be the same.
3.3. Mail Log Parsing
The syslog data emitted from the e-mail system has to be parsed by the analysis system in order for interesting data to be extracted.
3.3.1. Postfix Syslog Information
The e-mail infrastructure that supplied the source data for this work runs the Postfix MTA [28]. Four syslog message types are needed to track the flow of messages:
- Acceptance. Emitted when the software accepts a message for relay. The source address is provided, and if authentication was used the credentials are also logged.
- Message-ID. Emitted when the globally unique message-ID is found or generated. The message ID may have been generated by the client or programs that have previously processed this message. In this case the message ID would be written to the message’s headers, which the MTA can later extract and re-use for logging purposes.
- Sender. Emitted when the software processes a message in the queue. The message’s envelope sender is printed, along with other statistics such as the size of the message, and the number of recipients seen in this message. Note that the number of recipients seen cannot be trusted for accuracy, as prior servers may have split a message delivery to a larger number of recipients into parts.
- Recipient. Emitted once the result of a delivery attempt to a recipient is known. Provides 3 possible states for this result, either: a. Sent, the delivery was successful. A SMTP reply code of 200-299 was received. b. Deferred, the delivery failed but may succeed in the future and so is re-queued for a future attempt. A SMTP reply code of 400-499 was received. c. Bounced, the delivery failed and will not be retried. A SMTP reply code of 500-599 was received.
Deferred messages exhibit a transient state. Delivery is retried until either a concrete response is received (accept or reject) from the recipient’s mailservers, or all attempts to deliver the message fail within a specified timeframe. By standard, this timeframe is 7 days, but in practice many operators reduce it to a lesser number such as 3 or 5 days to reduce the size of their outbound queues.
Only the two final states of sent (accepted) and bounced (rejected) are of interest to this work.
3.3.2. Parsing a Large Volume of Events
The volume of events to be processed in order to build the desired complete view of a sender’s messages further constrains the solutions available to the problem.
Over the time the mail system under test was observed, an average of approximately 190,000,000 log messages were generated per week. This is a sustained average rate of 314 events per second, with peak levels many times this.
High end disk storage systems are required in order to have the input-output capacity to perform over 300 operations per second. Most syslog daemons batch writes into larger block in order to not impose high resource needs. For analysis it is important not to require high throughput and high cost storage systems that would incur a disk seek in order to read or write each event.
With this storage system constraint, the author decided to use an event stream processing system that operates in memory to handle the high volume first stage event parsing and aggregation.
3.4. Event Stream Processing
The syslog information emitted from an e-mail system is representable as an event stream. Each processing stage on each server generates an event. In order to build the desired complete view of what happens to a sender’s message, all the events related to this message must be captured and sequenced.
The science of working with and reacting to streams of events is Event Stream Processing (ESP) and Complex Event Processing (CEP), and is covered in detail in [29] and [30]. For this work, the open source ESPER [31] component was used to correlate and extract the required Postfix Acceptance, Message-ID, Sender and Recipient logging messages.
3.4.1. Selecting Events in a Stream
The ESPER component uses Event Processing Language (EPL) to express the conditions under which events or groups are to be selected from a stream. EPL is a SQL-like language.
A simplified event stream is presented in Figure 11. It shows a variety of postfix (A)cceptance, (M)essage-ID, (S)ender, and (R)ecipient syslog messages being processed as events. For brevity, this combination will be referred as AMSR from here on in.
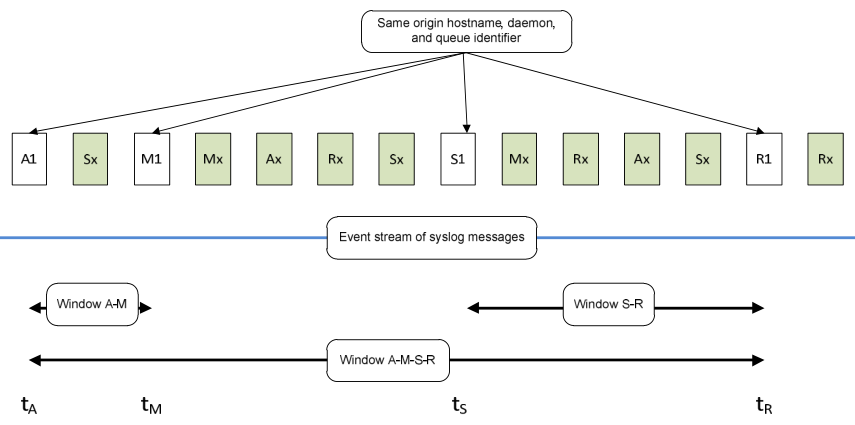
Figure 11: an event stream with postfix accept, message-id, sender and recipient events
When grouping processing on one host, the common data to aggregate on is the hostname, daemon, and queueID. Figure 12 shows an EQL statement capable of selecting the desired AMSR event from the event stream. Since the daemon is always postfix for this input data, the daemon component is ignored.
select pa, pm, pf, pt
from PostfixAccept:ext_timed(pa.timeLong, 10 minutes) as pa,
PostfixMessageID:ext_timed(pm.timeLong, 10 minutes) as pm,
PostfixSender:ext_timed(pf.timeLong, 10 minutes) as pf,
PostfixRecipient:ext_timed(pt.timeLong, 10 minutes) as pt
where pm.queueID = pa.queueID and
pm.queueID = pf.queueID and
pm.queueID = pt.queueID and
pm.hostname = pa.hostname and
pm.hostname = pf.hostname and
pm.hostname = pt.hostname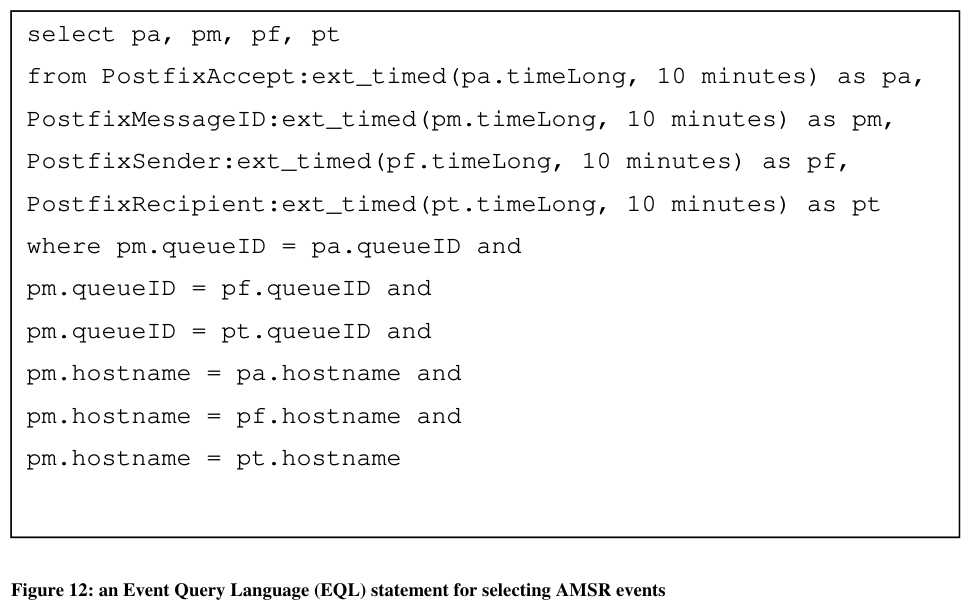
Figure 12: an Event Query Language (EQL) statement for selecting AMSR events
There are a few things to note in this process and EQL statement. First, the input syslog events must be pre-parsed and injected as Plain Old Java Objects (POJO), which makes their attributes accessible to EQL. Second, the queueIDs and hostnames are matched as previously mentioned. Third, the time window; each event’s object representation has attributes for the hostname, daemon, queueID, and syslog timestamp. The syslog timestamp, which is stored as an attribute named “timeLong” is used instead of the ESPER injection time so that the actual time the syslog message was generated is used as a basis for comparison. Using this external clocking (“ext_timed”) allows the system to catch up after a fault or processing peak and still produce the same output.
Also note that in practice there is no guarantee that these events will be logged in order – an M can be recorded before an A, and an R before an S. This is further reason to use ESP: it allows analysis systems to ignore arrival ordering, instead leaving ESPER to report all matching events within a selected time window.
3.4.2. Window Sizes
Next the proper window size must be selected. Event Stream Processors output events matched at the end of a given window. This means that when choosing a window size, it must be made large enough to observe an event of interest, but not so large that it is too late to act by the time the end of the window is reached. Larger window sizes also require more memory resources to maintain, offering a second practical limit to their size. A ten minute window was chosen for this work.
Figure 11 is marked with the times at which the individual AMSR events arrive as tA, tM, tS and tR. “A” & “M” events usually follow one another closely once a server decides to accept a message for delivery. “S” events do not begin until the e-mail queue is processed.
The time between the “S” and “R” events varies depending on how busy the sending & receiving servers are, the network bandwidth, and the size of the message. For the purposes of this work, it was assumed that the entire A, M, S and R events were emitted within 10 minutes of one another.
This covers most cases, with the exception of long run delivery re-try cycles. These occurred in a small minority of cases, and are excluded for simplicity. They could be re-introduced as SR events that do not have a matching AMSR combined event within the given time window.
3.5. Reconstructing the Message Path
The AMSR matching described in the sections above converts a high volume of individual events to a much lower volume of per-server events. Per-server because AMSR events match on hostname and queueID, both are unique at the server level only.
To rebuild the entire path that a message has taken, AMSR events must be aggregated as a multiple server transaction. This is done by matching the globally unique message-ID, with ordering done by timestamp. Timestamp ordering assumes that the servers have synchronized clocks, say by using Network Time Protocol (NTP).
Some merging of information is done when suitable AMSR sets are found. Authentication information if it exists will only be found on the system that first received the message from the customer. Subsequent servers within the email system relay by IP and so will not have this authentication information. Hence it is preserved if present when merging sets.
3.6. Identifying Spammers by SMTP Reply Code
This work uses one metric to determine whether a sender’s messages are likely to be spam, the SMTP response code. This is the same metric used by Clayton in 2004 ([21] and prior work section 2.8.2.3) on Daemon Internet (UK) email, but applied to a more complex set of servers, and with the intent of detecting both high and low volume spam.
For each reconstructed message, and each recipient in this message, the SMTP reply code of interest is the code seen on the last path a message took.
The sender is assumed to be spamming if in time its messages have a too high percentage of undelivered mail. The mail is undelivered usually because the e-mail address does not exist at the recipient system, either because it is mistyped, no longer exists or never existed. Because spammers harvest a lot of their e-mail addresses, a significant proportion of their lists have bad or old e-mail address data.
3.7. Reconstructed Message View
Bringing together all the concepts in the above section yields the reconstructed view of messages traversing the e-mail system’s outbound flows.
 1  SENDER[10]: user1@isp1,43,43,0,0,0
 2  message: 000001cba976$0fb13d60$2f13b820$@net.au
 3  sender: user1@isp1
 4  srcIP: 125.255.XX.YY
 5  auth: NO
 6  size: 1885701
 7  nrcpt: 3
 8  recipient: user2@hunterlink.net.au, path size: 2
 9        path[0]: mailproxy2.pacific.net.au[B455C27803] user1@isp1->user2@hunterlink.net.au status=SENT tries=1 destIP=61.8.0.85
10        path[1]: mailout2.pacific.net.au[007782AA1DC] user1@isp1->user2@hunterlink.net.au status=SENT tries=1 destIP=61.8.0.83
11  recipient: user3@bigpond.com, path size: 2
12        path[0]: mailproxy2.pacific.net.au[B455C27803] user1@isp1->user3@bigpond.com status=SENT tries=1 destIP=61.8.0.85
13        path[1]: mailout2.pacific.net.au[007782AA1DC] user1@isp1->user3@bigpond.com status=SENT tries=1 destIP=61.9.189.122
14  recipient: user4@companyA, path size: 2
15        path[0]: mailproxy2.pacific.net.au[B455C27803] user1@isp1->user4@companyA status=SENT tries=1 destIP=61.8.0.85
16        path[1]: mailout2.pacific.net.au[007782AA1DC] user1@isp1->user4@companyA status=SENT tries=1 destIP=203.0.AA.BB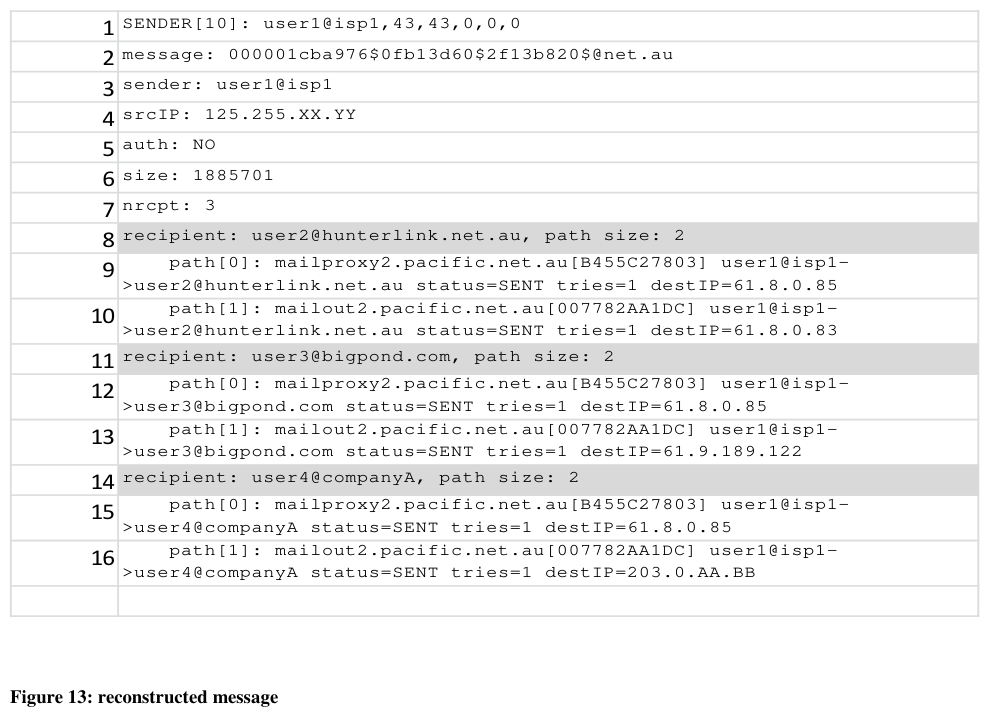
Figure 13: reconstructed message
Figure 13 shows a sample reconstructed view of a message generated by the analysis software written for this work. A few interesting parts of the view data:
- Line 1, for this envelope sender, the number of messages seen (43) and delivered successfully (43). A perfect delivery rate is unlikely to be spam.
- Line 2, The globally unique message ID
- Line 7, the message has 3 recipients, for each recipient the 2-hop path between a mailproxy and a mailout system is seen. Complete with the IP of and status reported by the receiving mail server (SENT is accepted).
Next, the analysis software is applied to two weeks’ worth of e-mail system logs as part of this thesis’ experiment.